Channeling, Centered Moving Averages, Law of Large Numbers, and Cycle Estimation: A Practical Guide
Introduction
This guide teaches you how to use channeling, centered moving averages (CLT), the law of large numbers, reversion to the mean, and how to estimate varying peak-to-peak cycle lengths in time series data. All concepts are illustrated with annotated charts for clarity.
1. Channeling with Centered Moving Averages
A centered moving average (CMA) helps you visualize cyclic activity by containing price movements within statistically derived boundaries.
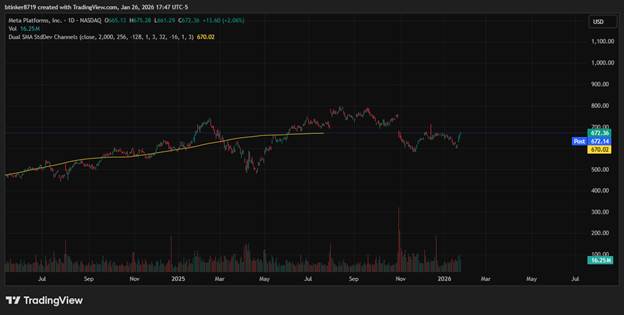
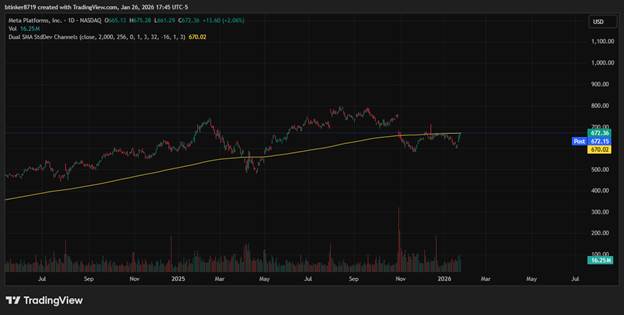
Why Centered?
Non-centered moving averages lead ahead of price, introducing errors in cycle estimation. Centered moving averages align with actual price movement, making cycle and trend identification more accurate.
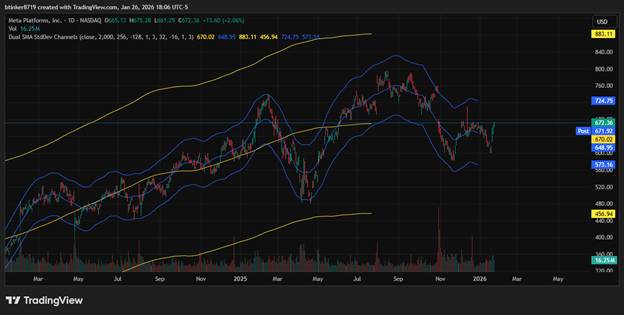
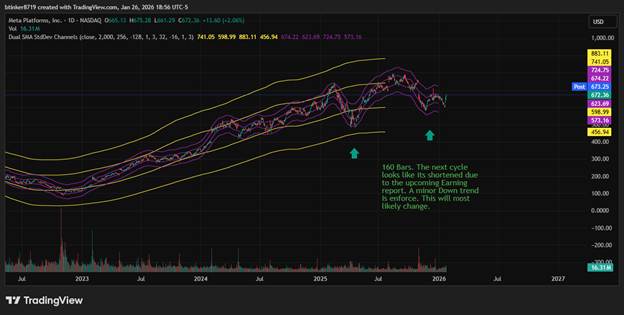
2. Drawing Statistical Boundaries (Channels)
By calculating the standard deviation of price from the moving average, you can draw boundaries (channels) at ±3 standard deviations. This contains about 99% of the data, showing the normal range of price movement.
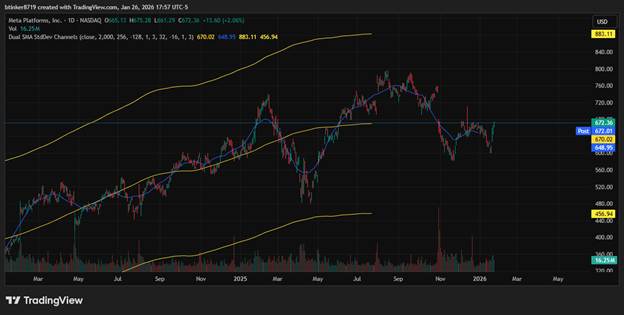
3. Law of Large Numbers & Reversion to the Mean
Over large samples, price extremes tend to revert toward the mean (the moving average). When price touches or exceeds the outer boundaries, it often signals a potential reversion, especially if supported by cycle indicators.
4. Estimating Cycle Lengths (Peak-to-Peak)
Cycles in financial data are rarely uniform. Estimating the time between peaks helps you anticipate future turning points.
How to Estimate:
- Identify cycle peaks using the centered moving average and channel.
- Count days between peaks.
- Calculate average cycle length and variability:
- Example: If intervals are 256 and 56 days, average = (256 + 56)/2 = 156.
- Standard deviation estimate: (256 – 156)/3 ≈ 33.
- Cycle length ≈ 156 days ±34 days (1 standard deviation).
5. Practical Steps
- Plot price data with a centered moving average (e.g., 32-day or 256-day).
- Calculate and plot standard deviation channels.
- Mark cycle peaks and measure intervals.
- Use the law of large numbers and reversion to the mean to interpret price extremes.
- Refine cycle estimates with more data or advanced techniques like Fourier analysis.
Disclaimer
This post is for educational purposes only. The concepts and methods described are intended to illustrate statistical analysis techniques and should not be interpreted as financial advice or recommendations for trading or investing. Always consult a qualified financial professional before making investment decisions. Past performance does not guarantee future results.