Reversion to the Mean
Why Extreme Outcomes Rarely Stay Extreme
Some ideas in statistics sound complicated but explain very familiar real‑world patterns. Reversion to the mean (sometimes called regression to the mean) is one of those ideas.
It shows up in business, sports, investing, hiring decisions, and even everyday life—and once you see it, you’ll spot it everywhere.
Let’s break it down.
What Is Reversion to the Mean?
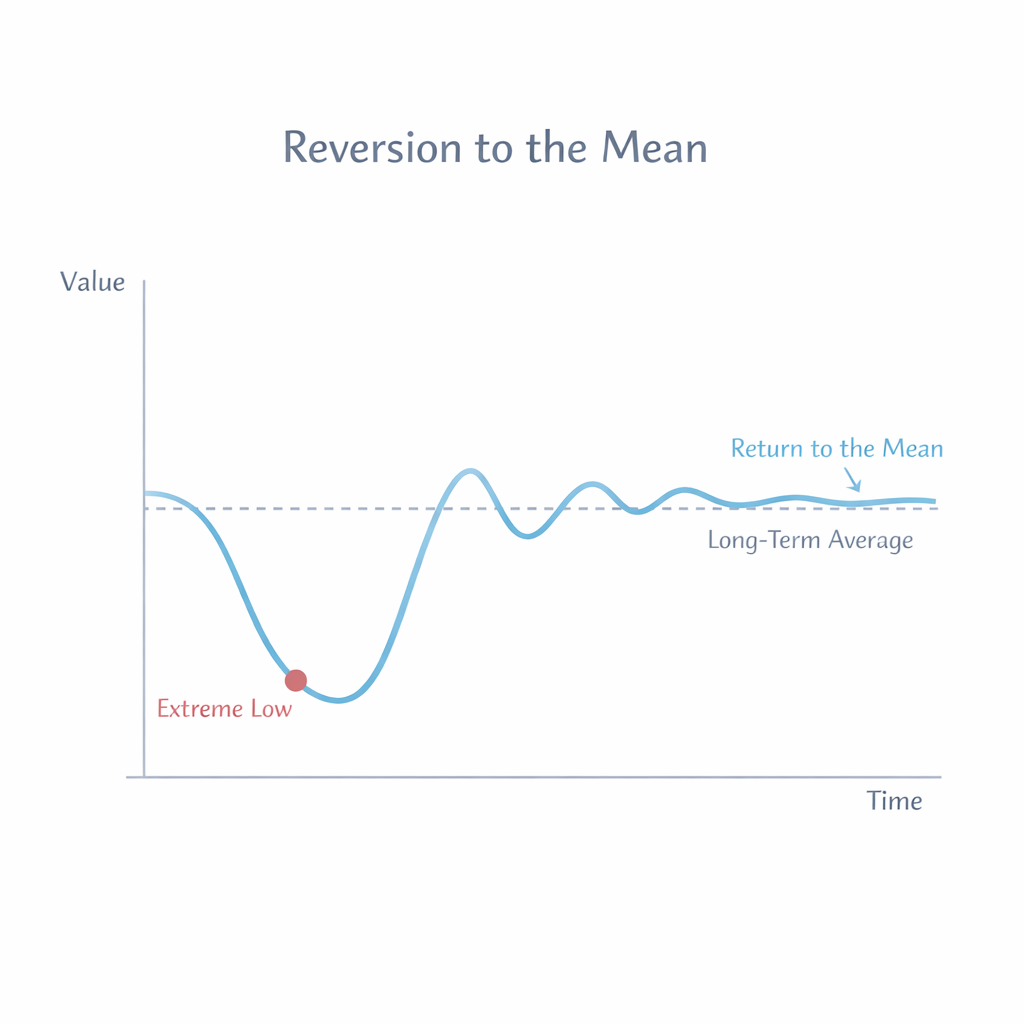
Reversion to the mean is the tendency for unusually high or unusually low results to be followed by results that are closer to the long‑term average.
In simple terms:
Extreme performances usually drift back toward normal over time.
It doesn’t mean things “get worse” or “get better.”
It just means the extremes don’t last forever.
A Simple Example
Imagine you bake chocolate chip cookies every weekend.
Most batches taste pretty similar, but once in a while:
- one batch is amazing—tons of chips, perfect texture
- the next one is weirdly disappointing
Why?
Because luck and randomness play a role. The exceptional batch involved a few lucky coincidences (even chip distribution, perfect oven conditions).
Next week, those coincidences probably won’t repeat.
So your cookies return to their usual quality—closer to the average.
That’s reversion to the mean.
Where We See It in Real Life
1. Sports performance
A player scores an unusually high number of points one game.
The next game? Usually something closer to their typical performance.
2. Stock market returns
A stock that skyrockets one year often grows more modestly—or even falls—the next.
Not because it is “bad,” but because extreme years are just that: extreme.
3. Employee productivity
Someone has one incredible week or one terrible week.
The following week tends to look much more normal.
4. Marketing campaign results
A campaign that performs shockingly well often sees a more ordinary follow-up.
Same creative team, same effort—different luck.
Reversion to the mean helps us avoid overreacting to outliers.
Why Does Reversion to the Mean Happen?
Two key reasons:
1. Randomness
Every performance contains some element of chance—weather, mood, timing, market news, or pure luck.
2. Natural variability
Most real-world systems hover around a stable average.
When something deviates drastically, it is often because multiple random factors aligned.
Once those factors return to normal, performance does too.
How It Relates to the Law of Large Numbers
Reversion to the mean and the Law of Large Numbers (LLN) are often confused because they’re siblings in the family of statistical intuition.
✔ Law of Large Numbers
The average of many trials converges to the true long-term average.
✔ Reversion to the Mean
Extreme short-term results tend to move closer to the long-term average in subsequent observations.
How they connect
- LLN explains the long-run tendency: averages stabilize with more data.
- Reversion to the mean explains the short-run tendency: extremes normalize over time.
Together, they remind us:
Don’t overreact to single datapoints—look for long-term patterns.
A Great Mental Model
Think of shooting arrows at a target:
- Occasionally, by luck, you hit near the bullseye even if you’re not that skilled.
- The next shots? Probably not as impressive.
- But if you’re a skilled archer, repeated arrows will cluster near the center.
Reversion to the mean doesn’t judge you.
It just tells you not to take extreme events at face value.
Final Thoughts
Reversion to the mean is a powerful idea that protects us from making misguided decisions:
- “This salesperson is a superstar after one month!”
- “This fund manager beat the market once—they must be a genius!”
- “This athlete is slumping—they’re done!”
In reality, much of what looks like dramatic change is simply normal variation moving back toward average.
Understanding this principle leads to better decisions, calmer thinking, and smarter interpretations of data.