How Statistical Laws Shape Stock Channel Forecasts: A Practical Guide
Understanding how stock price channels work can give you a powerful edge in forecasting market turns. In this post, I’ll break down how the law of large numbers, the central limit theorem, and mean reversion all come together to define the boundaries of a stock’s price channel. I’ll also show you how to use parallel line extrapolation to spot likely turning points—complete with guidance on where to place your charts for clarity.
1. The Statistical Foundations of Price Channels
Law of Large Numbers: Why More Data Means More Reliable Boundaries
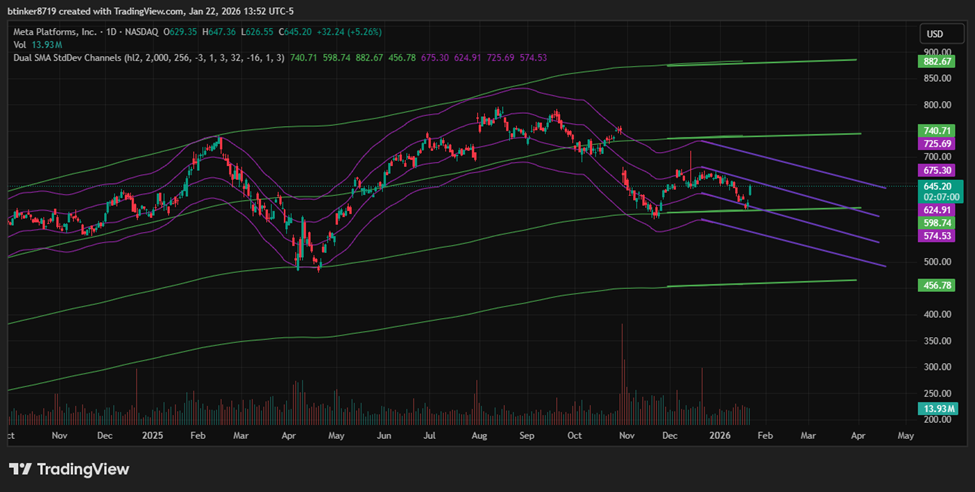
The law of large numbers tells us that as we collect more price data, our calculated averages (like moving averages) become more representative of the stock’s true behavior. This is why long-term channels—such as a 256-period moving average—provide stable, trustworthy boundaries for price action.
Central Limit Theorem: Why Probability Boundaries Matter
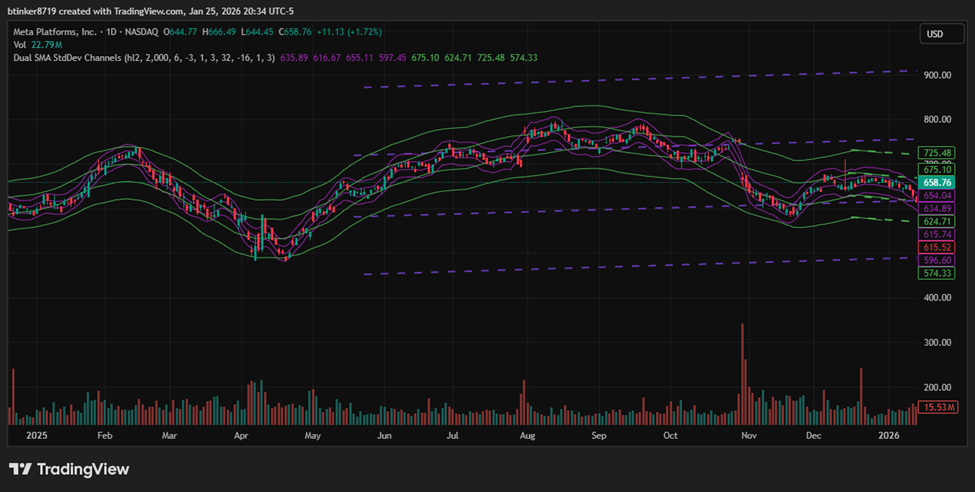
The central limit theorem explains why, as we aggregate more price data, the distribution of returns starts to resemble a bell curve. This makes statistical boundaries—like standard deviation bands—meaningful. When price touches these outer bands, it’s a statistically rare event, often followed by a reversal.
Mean Reversion: The Tendency to Return to Average
Extreme price moves are usually followed by a return toward the average. When price reaches the outer boundary of a channel, it’s likely to “snap back” toward the mean. This is the core principle behind mean reversion.
2. Extrapolation with Parallel Lines: Spotting the Turn
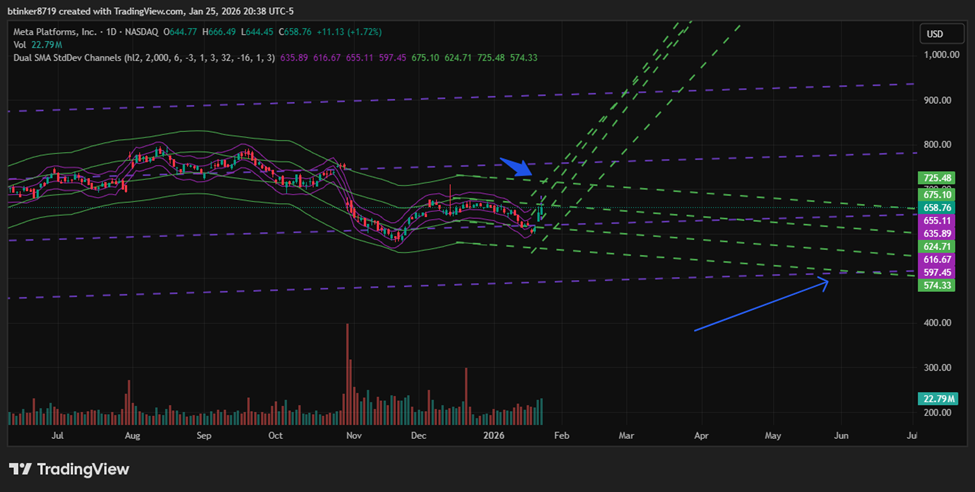
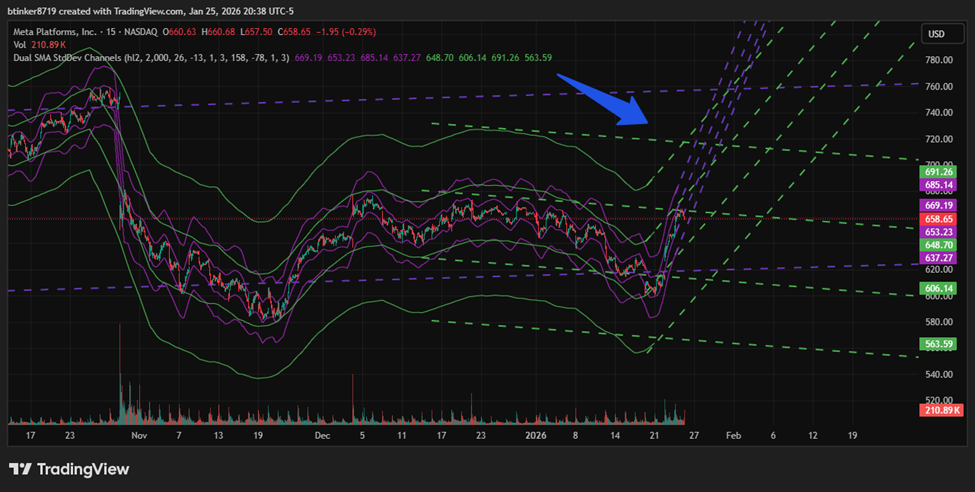
By drawing parallel lines that follow the slope of the trend, you create a channel that contains most price action. Extrapolating these lines into the future lets you forecast where price is likely to encounter support or resistance.
When price approaches the upper or lower boundary of this channel, it’s statistically more likely to reverse direction—especially if the broader trend is slowing or turning down.
3. Practical Takeaways
- The more data you use, the more reliable your channel boundaries become.
- Probability boundaries (like standard deviation bands) help you spot statistically significant moves.
- Price tends to revert to the mean after hitting extreme boundaries.
- Extrapolating parallel lines helps you visualize where the next turn is likely to occur.
Disclaimer
This analysis is for informational and educational purposes only and does not constitute financial advice. Stock trading involves risk, and past performance is not indicative of future results. Always conduct your own research or consult with a qualified financial advisor before making investment decisions.