How to Paper Trade QQQ Using Statistical Principles
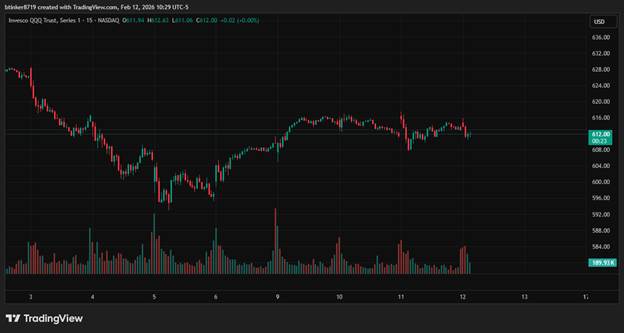
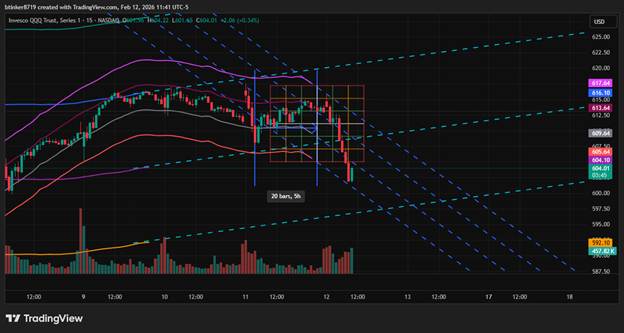
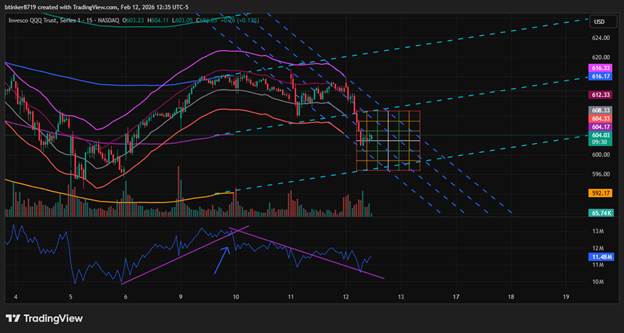
1. Build Price Channels to Understand Structure
To begin, plot your long‑term and short‑term channels.
Use these channels show how price tends to stay within statistically predictable boundaries.
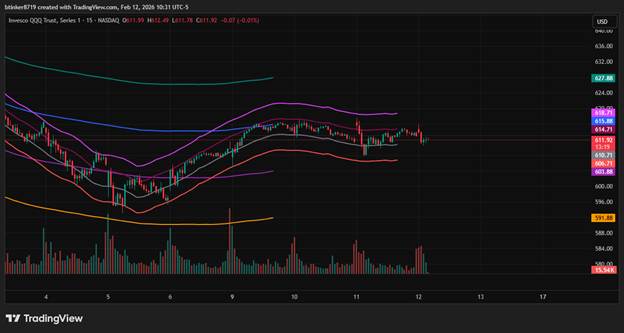
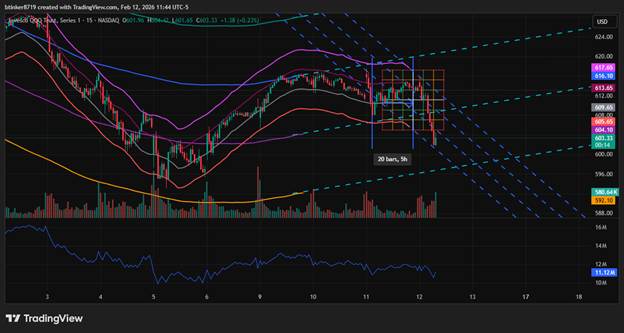
2. Understanding Channel Boundaries with Statistics
Your inner and outer channel boundaries approximate standard deviation zones.
Use these to visually reinforce how price behaves within different levels of deviation.
Price Within the Inner Channel
This illustrates that price tends to oscillate inside the inner bands most of the time.
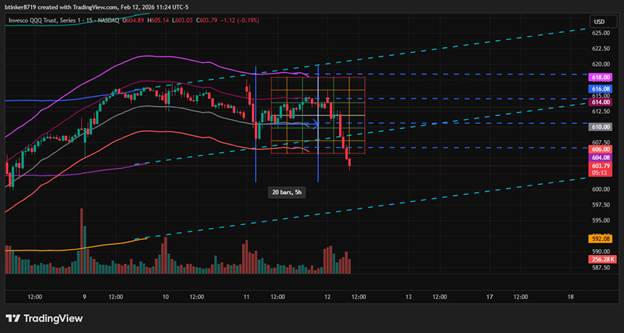
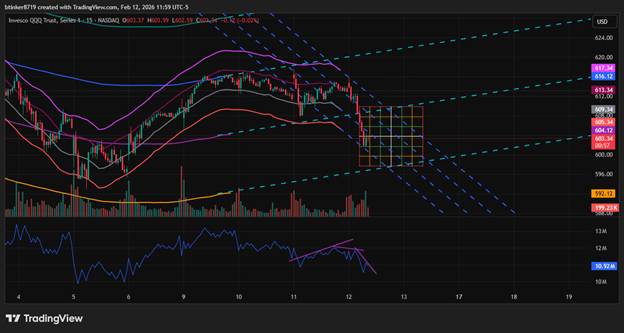
3. Using Cycle Counts to Estimate Mean Reversion Timing
You’re counting how often price travels below and back above the inner lower channel.
| Daily inside weekly | ||
| 26 units within 130 in 15 min increments | 3dev | 402 |
| 2dev | 341.8333333 | |
| 1dev | 281.6666667 | |
| ave | 221.5 | |
| Minus 1 dev | 161.3333333 | |
| Minus 2 dev | 101.1666667 | |
| Minus 3 dev | 41 | |
| Longest | 402 | |
| shortest | 41 | |
| ave | 221.5 | |
| Dev | 60.16666667 | |
| 15 min inside a day | ||
| Longest | 36 | |
| shortest | 4 | |
| ave | 20 | |
| Dev | 5.333333333 |
This is where the Law of Large Numbers helps — with enough observations, your average cycle duration becomes reliable.
4. Visualizing the Average Cycle Distance
Use a Date and time tool here. This connects your statistical cycle length (20 bars ± 5) to the chart visually.
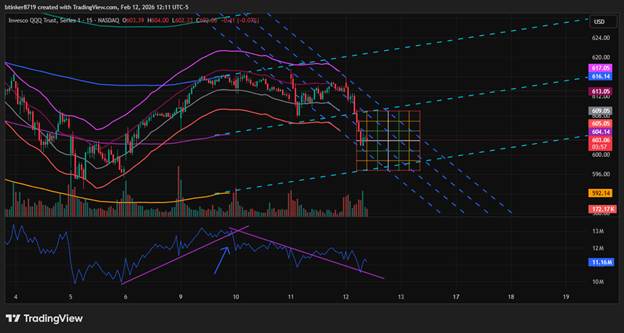
5. Observing Trend Influence Across Timeframes
The 130‑bar trend exerts force on the smaller 26‑bar trend.
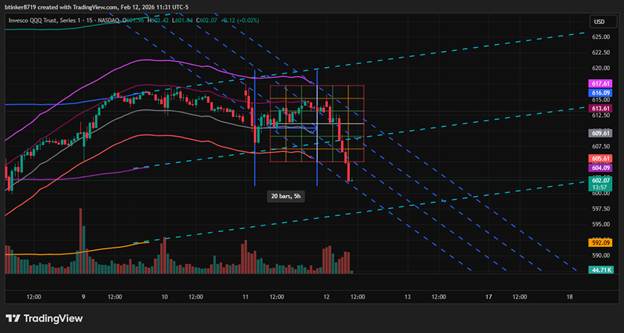
6. Confirming Trend Shifts Using Volume (OBV)
Finally, validate price behavior using On‑Balance Volume.
Disclaimer
The information provided in this teaching guide is for educational and illustrative purposes only. It is designed to demonstrate statistical concepts and paper‑trading techniques using historical price behavior and should not be interpreted as financial advice, investment recommendations, or guidance for real‑world trading.