How to Use SMA Channels and Statistical Principles to Find the Best Trade Entry
When it comes to trading, finding the right entry point can make all the difference. One powerful approach combines technical analysis with foundational statistical concepts: the law of large numbers, the central limit theorem, and reversion to the mean. Let’s break down how these ideas can help you use inner and outer Simple Moving Average (SMA) channels to time your trades more effectively.
The Statistical Edge Behind SMA Channels
Law of Large Numbers
Over time, as more price data accumulates, the average price (often represented by the central SMA) becomes a more reliable indicator of the market’s true value. This means that, in the long run, prices tend to gravitate toward this average.
Central Limit Theorem
No matter how wild or unpredictable price movements seem, the central limit theorem tells us that, with enough data, price changes will cluster around the mean. Most of the time, prices will hover near the central SMA, with fewer excursions to the extremes.
Reversion to the Mean
This is the trader’s bread and butter: after a significant move away from the average, prices are statistically likely to snap back toward the mean. The outer SMA channels mark these extremes, while the central SMA represents the mean.
Applying This to Your Trading
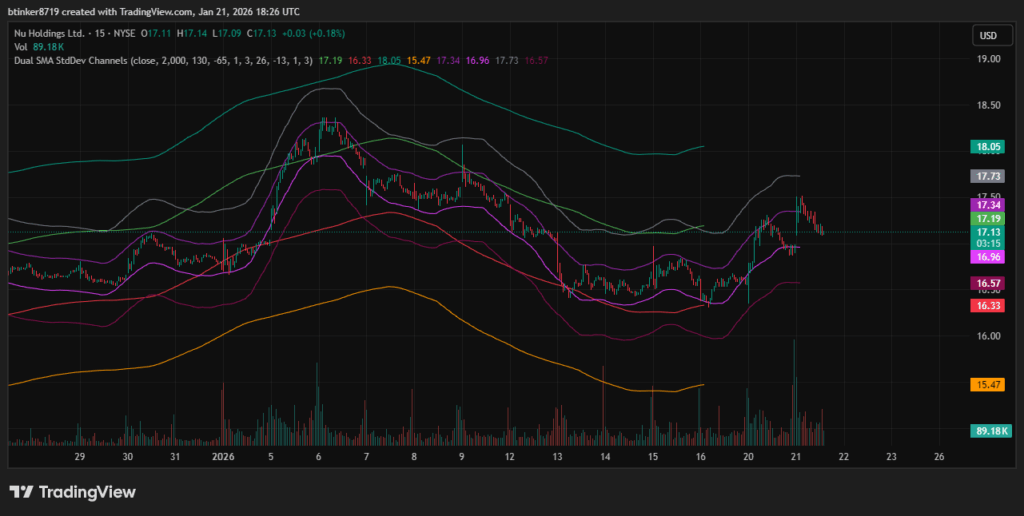
- Outer SMA Channels: These lines show where price has deviated farthest from the mean. When price touches or exceeds these channels, it’s statistically stretched and more likely to revert back.
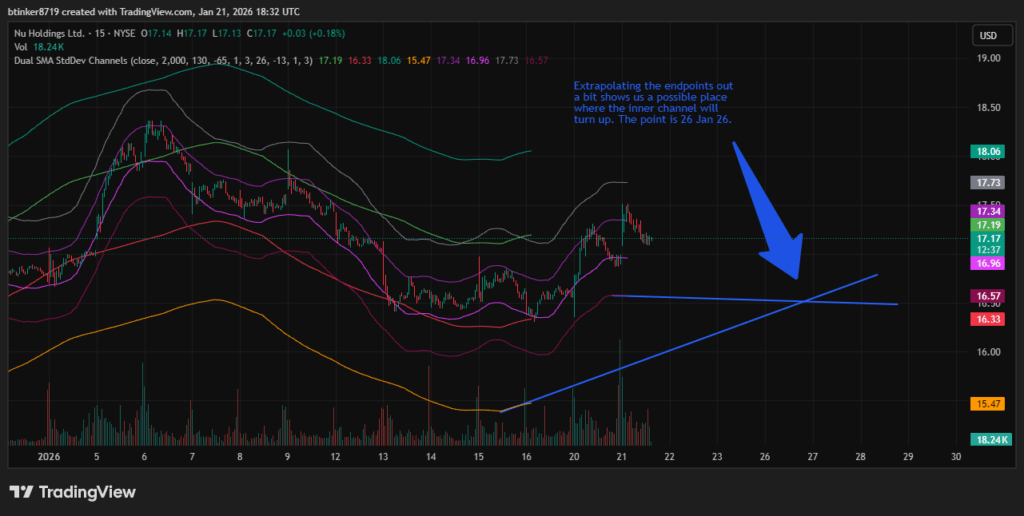
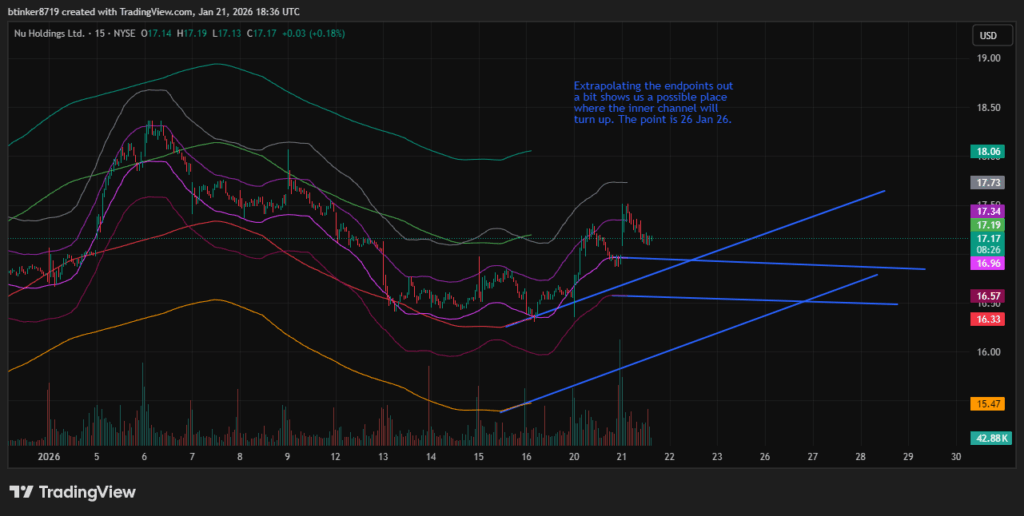
- Inner SMA Channels: These are closer to the mean and represent less dramatic deviations.
The Best Entry Point
The sweet spot for entering a trade is when price approaches or touches the outer SMA channel and then shows signs of reversing. Why? Because at this point, the price is statistically overextended, and the odds favor a move back toward the mean. Look for confirmation signals—like reversal candlestick patterns or a spike in trading volume—before pulling the trigger.
Example:
If price hits the upper outer SMA channel and starts to reverse, consider a short trade, betting on a move back to the central SMA. If it touches the lower outer channel and reverses, a long trade may be in order.
| Channel Touched | What It Means | Possible Action |
|---|---|---|
| Outer SMA | Extreme deviation, likely to revert | Enter trade toward mean |
| Inner SMA | Moderate deviation | Wait or scale in/out |
| Central SMA | At the mean | Avoid new entries, consider exits |
Final Thoughts
By combining SMA channels with these statistical principles, you can add a layer of probability to your trading decisions. Remember, no strategy is foolproof, but understanding the math behind the markets can give you a valuable edge.
Disclaimer
Trading financial instruments involves significant risk and may not be suitable for all investors. The information provided here is for educational purposes only and does not constitute financial advice. Always conduct your own research and consult with a qualified financial advisor before making any trading decisions. Trade at your own risk.