Understanding Channel Oscillation and Probability Boundaries
1. Channels as Probability Boundaries
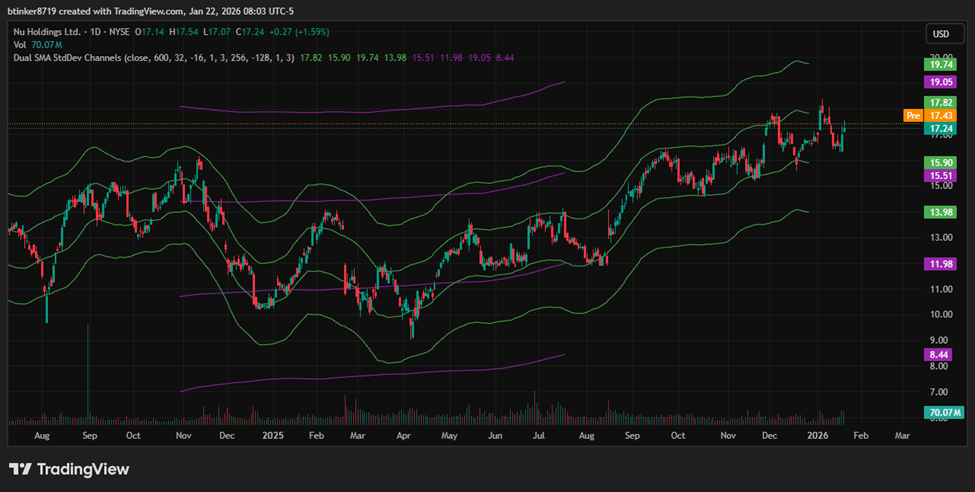
The channels shown on the charts are constructed using standard deviations from a centered moving average. The boundaries (upper and lower bands) represent areas where, based on historical price action, the price is likely to remain a certain percentage of the time (e.g., 68% for ±1 standard deviation, 95% for ±2 standard deviations). This is analogous to a confidence interval in statistics: the bands are dynamic, expanding and contracting as volatility changes.
2. Oscillation of Channels Across Time Frames
Larger Time Frame (256-day channel) with 32-day channel oscillating inside
The 256-day channel sets the broader context for price movement. It moves more slowly and represents the “macro” trend. The 32-day channel, meanwhile, oscillates within the larger channel, capturing shorter-term fluctuations. The smaller the time frame, the more sensitive the channel is to recent price changes, causing it to oscillate more rapidly within the boundaries of the larger channel.
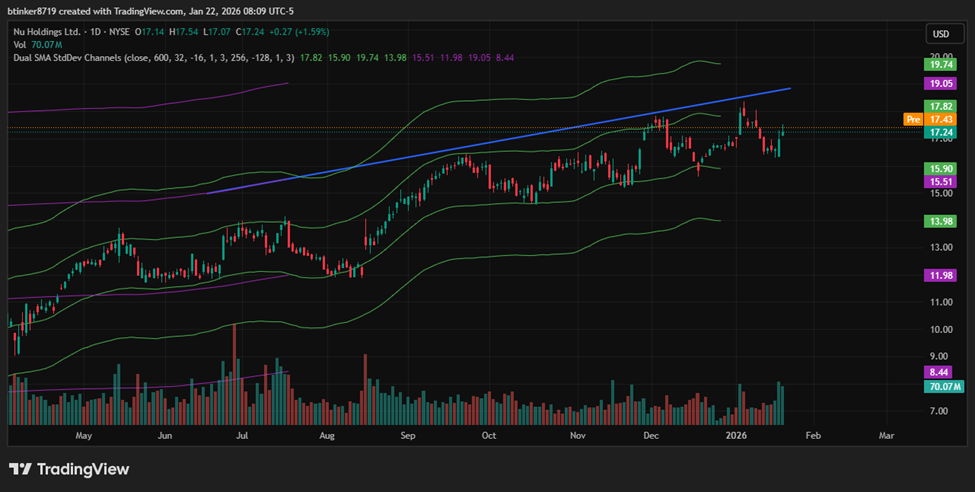
The Core Trading Zone
The blue line is a tangential extrapolation from the channel derived from the first standard deviation of the 256-day channel highlighting the top of the channel where most trading activity occurs. The middle channel is the “core” of the probability distribution.
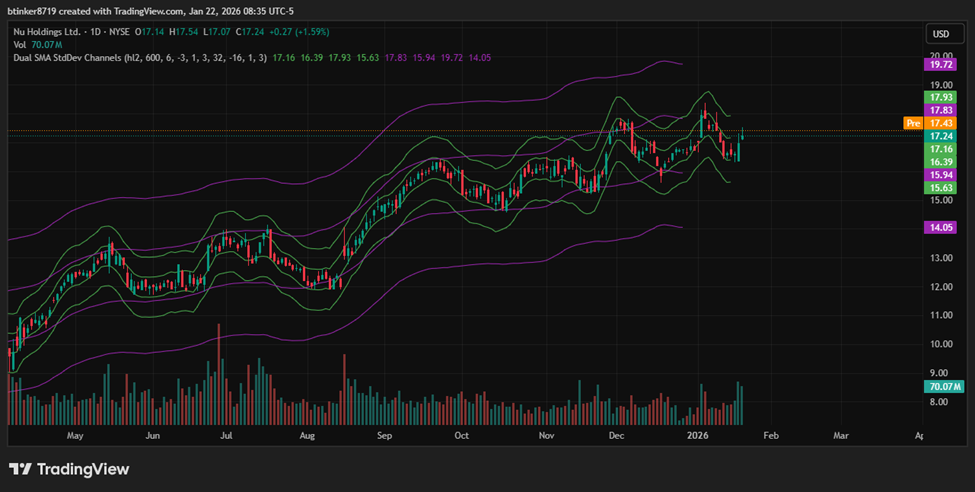
Zooming In: 32-day and 6-day Channels
Here’s a closer look at the 32-day channel and the 6-day channel within it. The smallest time frame oscillates even more rapidly within the 32-day channel.
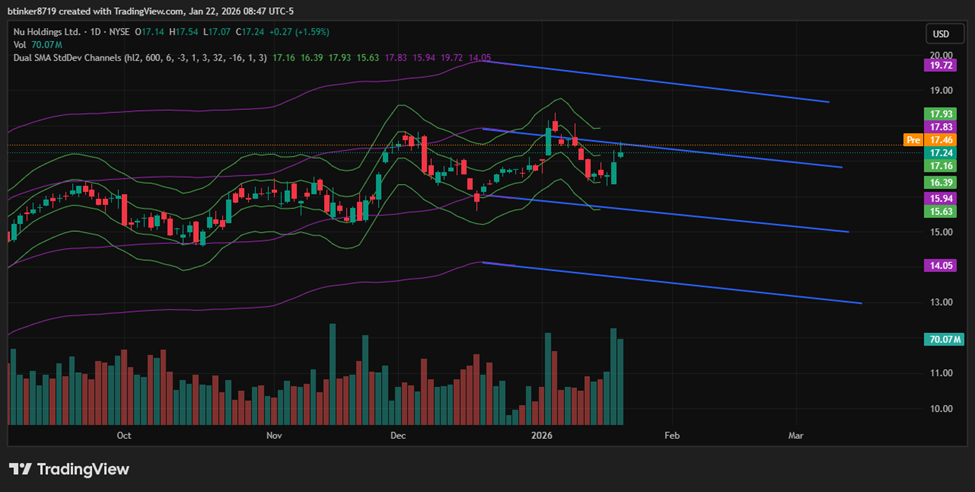
Trend Interaction
Using tangents of the lower channels, we can see that the 32-day trend is beginning to slow but may probably turn up due to the influence of the 256-day channel. This demonstrates how larger trends can possibly “pull” shorter trends back into alignment. It hasn’t pulled yet, but the fundamentals are good and the 256-day trend is strong.

3. Trend Persistence and Change
A trend in motion tends to persist unless a significant force (another trend or external factor) causes a reversal. When the shorter-term channel (e.g., 32-day) is moving in the same direction as the longer-term channel (256-day), the trend is reinforced. If the shorter-term channel starts to slow or reverse while the longer-term channel remains strong, it often signals a potential pause or minor reversal, but the dominant trend may continue unless the longer-term channel also turns. What is shown below is how the 6-day channel is moving within the 32.
Disclaimer for Traders
The information and analysis provided here are for educational purposes only and do not constitute financial advice, investment recommendations, or an offer to buy or sell any security. Trading and investing in financial markets involve significant risk, including the potential loss of your investment. Past performance is not indicative of future results.
Before making any trading decisions, please conduct your own research, consider your financial situation, and consult with a licensed financial advisor if necessary. The use of probability channels, trend analysis, and other technical tools should be supplemented with sound risk management practices. Neither the author nor any associated parties are responsible for any losses incurred as a result of using this information.