Using Channels and the Central Limit Theorem for Forecasting
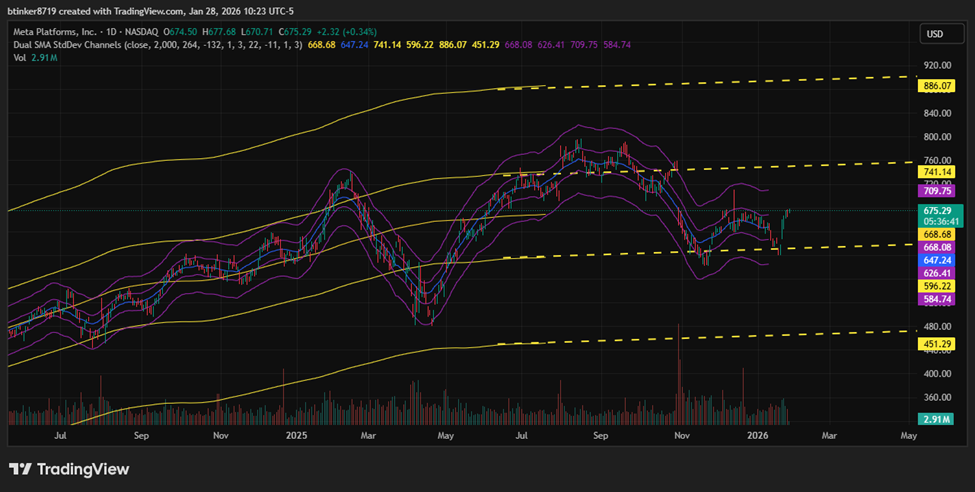
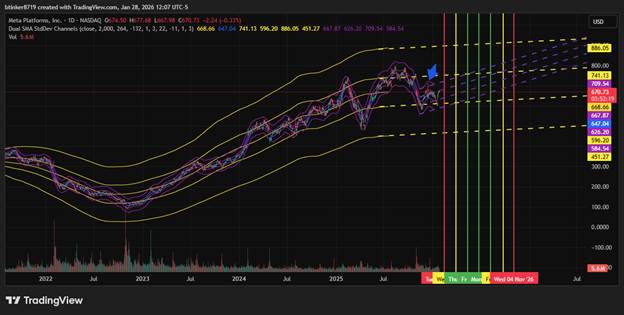
I’ve been exploring TradingView and developed a custom indicator using Pine Script and Microsoft Copilot. This tool helps visualize price channels and forecast future movements, and it’s exceeded my expectations so far. The chart below shows Meta’s price action within 256-day boundaries, with 32-day sub-channels nested inside. The broken lines represent extrapolations, a feature I’m just discovering in TradingView—a true gold mine for analysis.
How the Central Limit Theorem Shapes Forecast Boundaries
The central limit theorem (CLT) is fundamental in drawing statistical boundaries for both time and magnitude in my forecasting approach. Here’s how it works in practice:
- Cycle Identification: By counting the peaks within the price data and calculating their average and deviation, I identified a “cycle key” of 140 days ± 31 days. This means most cycles (price peaks) occur roughly every 140 days, but there’s natural variation.
| Estimated Peak date range | |||
| 32 inside 256 | 3dev | 233 | 4-Nov-26 |
| Date of last Peak | 2dev | 202 | 22-Sep-26 |
| 12-Dec-25 | 1dev | 171 | 10-Aug-26 |
| ave | 140 | 26-Jun-26 | |
| Minus 1 dev | 109 | 14-May-26 | |
| Minus 2 dev | 78 | 1-Apr-26 | |
| Minus 3 dev | 47 | 17-Feb-26 | |
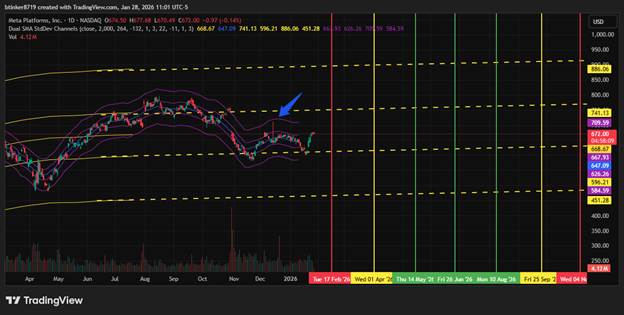
- Probability Bands for the Next Peak: The CLT tells us that, as we aggregate more cycles, their average timing will tend to form a normal distribution. From the last high peak, there is a:
- 68% chance that the next peak will fall between the green vertical lines,
- 95% chance it will fall between the yellow lines,
- 99.7% chance it will fall between the red lines. These colored boundaries on the chart visually represent the statistical likelihood of when the next high peak will occur, based on historical data.
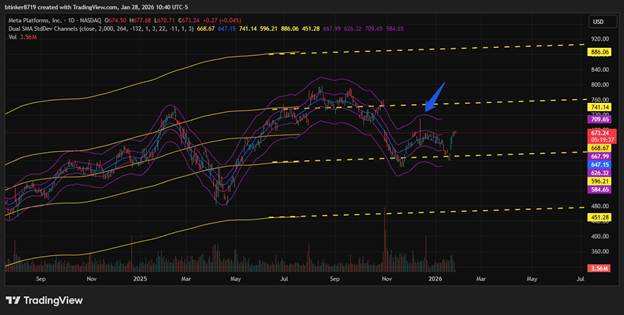
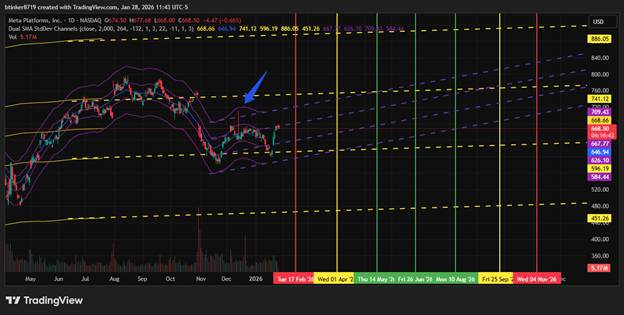
- Magnitude Channels: In a similar fashion, price channels are formed by calculating the range of price fluctuations across both 256-day and 32-day intervals. Most price action aggregates within the first channel, as predicted by the CLT, with outliers occasionally breaking through. I’ve used the bottom peaks of the 32 day channel and extrapolated the possible trajectory of that channel.
Practical Example
For Meta, the last high was on December 12, 2025. Using the CLT-based cycle key, I estimated the next peak dates and their probability ranges. The vertical lines on the chart mark these forecasted windows, helping visualize where the next top might occur. The same logic applies to magnitude: most price movements stay within the main channel, with only rare events pushing beyond.
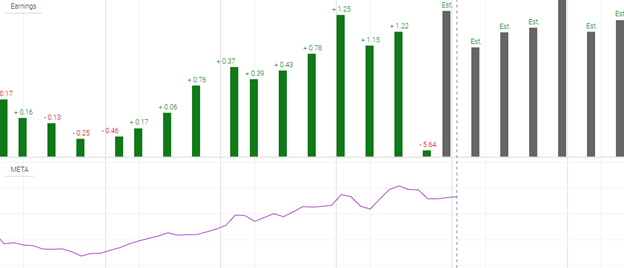
Earnings and Channel Reactions
The 32-day channel is particularly sensitive to changes in Meta’s quarterly EPS (earnings per share). For instance, heavy investment in AI and data centers, ongoing losses in Reality Labs, and moderate advertising growth all contributed to recent EPS fluctuations, which in turn affected the channel’s wave shape.
Disclaimer
This post is for informational and educational purposes only. The forecasting methods described here, including the use of the central limit theorem and statistical channels, are experimental and should not be considered financial advice. Past performance does not guarantee future results. Always conduct your own research and consult a qualified financial advisor before making investment decisions.